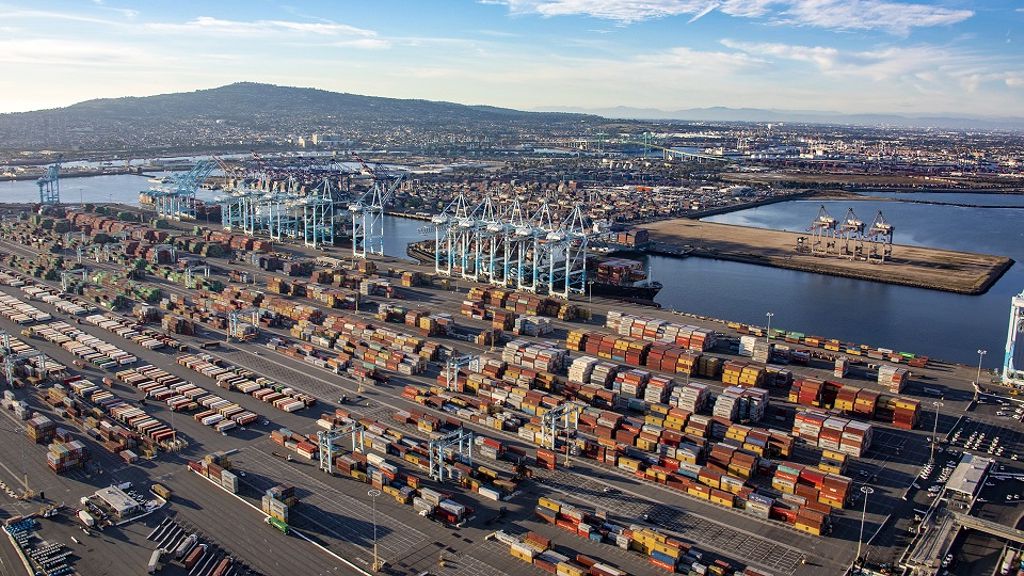
Remember back in 2021 and even more recently when we kept hearing about massive supply chain issues driving inflation? See below one expert’s comment.
“Higher inflation today reflects a restricted goods supply at the same time, there’s strong demand for many of those same goods,” says Tom Hainlin, national investment strategist at US Bank. The most notable examples of restricted supplies revolve around energy and food products, related in large part to the war between Russia and Ukraine.
Certainly, the energy sector is suffering supply chain issues due to the Ukraine conflict, but is this still true with other product areas? Supply chain issues are becoming less of a problem, as recent transport shipping data seems to imply.
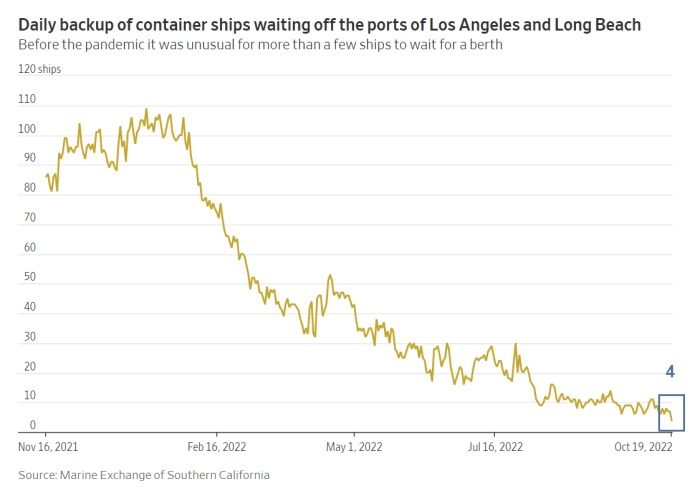
- The queue of ships waiting to unload at the ports of Los Angeles and Long Beach fell from a peak of 109 ships in January to four vessels this week.
- Descartes Datamyne, a data analysis group owned by supply-chain software company Descartes Systems Group Inc., says container imports to the US in September declined by 11% from a year earlier and by 12.4% from August.
- Shipping lines have canceled between 26% to 31% of their sailings across the Pacific over the coming weeks, according to Sea-Intelligence
- In September 2021, the average cost of shipping a container from Asia to the US West Coast exceeded $20,000. Last week, the average cost to ship a container from Asia to the US West Coast had declined 84% from a year earlier to $2,720.
See the recent trend data in the chart below and learn more here.
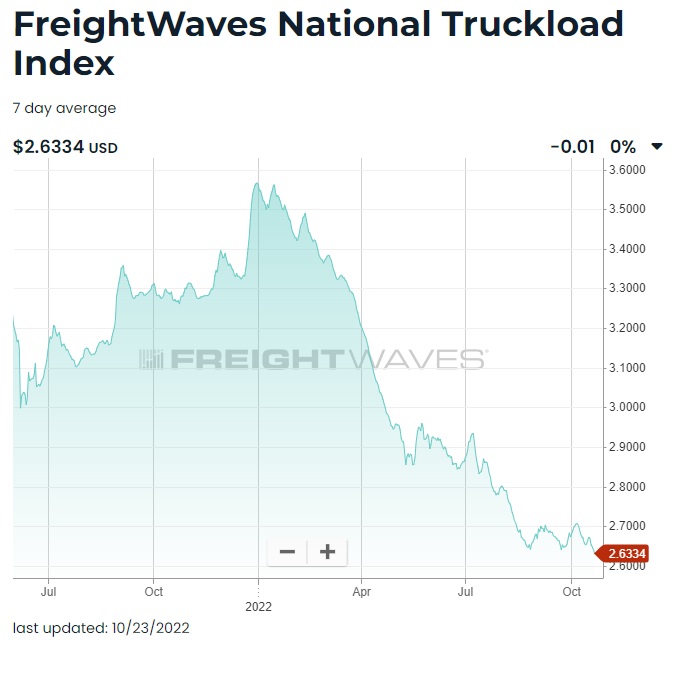
This decline in shipping is not just container vessels at sea. FreightWaves National Truckload Index (NTI) is a seven-day moving average of spot rates that measures the US for-hire, over-the-road dry van trucking market. A real-time proxy for the health of the national supply chain used by freight and non-freight businesses. This index has recently fallen off the cliff from its previous extreme highs. See this in the chart below and see the source data here.
Already, the drop-off in trucking demand is causing bankruptcies in the trucking industry.
We are on the cusp of a Great Purge in trucking capacity, as carriers struggle to keep up with challenging conditions. The latest carrier to shutter. — Craig Fuller 🛩🚛🚂⚓️ (@FreightAlley) October 21, 2022
So the good news is that supply chains are clearing their backlogs. The bad news is that the reasons for clearing the backlogs are not because they have fixed supply chain issues but rather because there is simply less product being shipped. Looking at the table below, one can see that import volumes at the LA Port are back to levels seen in the 2008-2009 Great Recession era.
The real reason that supply chain constraints are easing is because far fewer goods are moving through the supply chain. The last time that the port of LA handled so few loaded import containers in September was during the Great Financial Crisis.Craig Fuller 🛩🚛🚂⚓️ (@FreightAlley) October 22, 2022
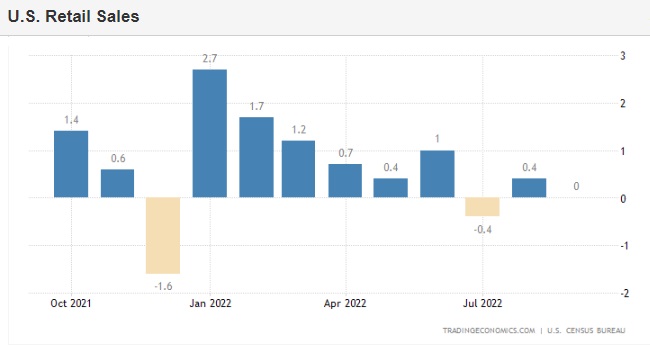
The slowing product demand in the supply chains would normally eventually translate to lower retail sales. Sure enough, we are starting to see this in the macroeconomic statistics. US retail trade was unchanged in September 2022, missing market expectations of a 0.2 percent advance, as high inflation, and rising borrowing costs hit consumer demand. The recent trend has been declining retail sales. See this in the chart below and see the source data here.
It should be noted that retail sales are lagging data points compared to shipping volume data for obvious reasons. One needs to ship the product to the retail point before one can sell it.
So here are the key takeaways from this data.
- Supply chains, at least in the non-energy sectors, are beginning to improve.
- Supply chains are improving not because supply chains are necessarily fixed but rather because fewer products are being shipped to alleviate the problem.
- Though supply chains are improving, prices are not falling – hence the idea that supply chains were causing inflation was largely false.
- Both shipping volumes and retail sales indicate that the economy is starting to falter – and possibly in a big way. Though there are several factors involved, largely, this has been Fed induced with higher interest rates in order to fight inflation.
As the Fed continues its interest rate hike cycle, the longer-term question becomes how low the Fed will allow the economy to falter before a pivot. See here for more details on this question.
By Tom Williams

