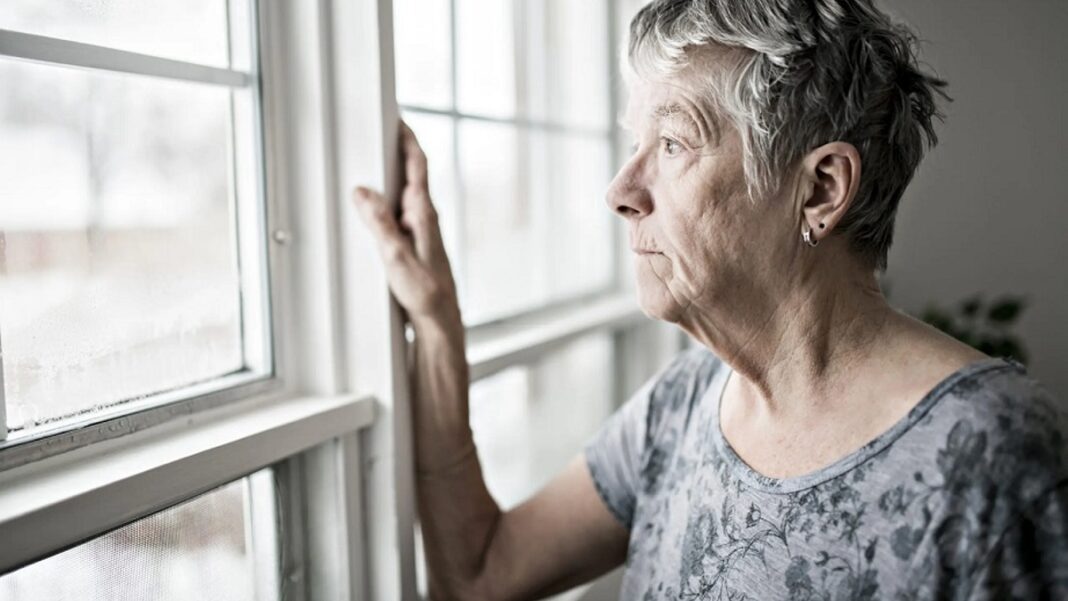
Jay Miles has lived his 52 years without marriage or children, which has suited his creative ambitions as a videographer in Connecticut and, he said, his mix of “independence and stubbornness.” But he worries about who will care for him as he ages.
Donna Selman, a 55-year-old college professor in Illinois, is most grateful to be single, she said, because her mother and aunts never had the financial and emotional autonomy that she enjoys.
Mary Felder, 65, raised her children, now grown, in her rowhouse in Philadelphia. Her home has plenty of space for one person, but upkeep is expensive on the century-old house.
Ms. Felder, Mr. Miles, and Ms. Selman are members of one of the country’s fastest-growing demographic groups: people 50 and older who live alone.
In 1960, just 13 percent of American households had a single occupant. But that figure has risen steadily, and today it is approaching 30 percent. For households headed by someone 50 or older, that figure is 36 percent.
Nearly 26 million Americans 50 or older now live alone, up from 15 million in 2000. Older people have always been more likely than others to live by themselves, and now that age group – Baby Boomers and Gen Xers – makes up a bigger share of the population than at any time in the nation’s history.
Recent data from the Census Bureau’s Current Population Survey (CPS) shows that the share of adults who live alone has nearly doubled in the last 50 years. In 2019, 14.6 percent of adults lived by themselves.* The rise of single-person households is due to a variety of factors, according to research publication Our World in Data, including rising incomes, migration from rural areas to cities, and increased female labor force participation. See this in the chart below and learn more here.
With regard to gender, men aged 25 to 64 are more likely than women to live by themselves, but this trend reverses for individuals over age 65. Differences in age at first marriage, likeliness to remarry, and life expectancy explain much of the divergent trends in living patterns for men and women, as the chart below shows.
The Baby Boomers and Gen Xers have spent decades pursuing their interests – though not forgotten, marriages and traditional families often have taken a back seat. You know what people say – “better to live alone than live unhappy.” That worked when we were enjoying the fruits of our efforts. But later in life, perhaps some are beginning to question these priorities. Perhaps, we simply have been too selfish with our independence and now will pay the price.
Is it too late?
By Tom Williams


