As we all know, in 2022, inflation hit a 40-year high. Though inflation is starting to abate due to the Fed’s actions to reduce it with higher interest rates, one wonders if inflation is set to decline permanently and/or plateau out at lower levels.
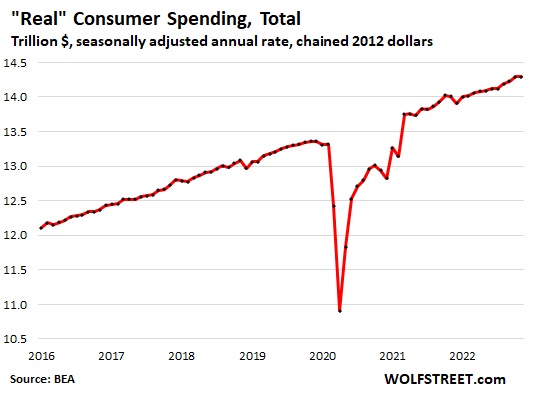
To answer this question, it may be helpful to look at the shape of inflation, at least at the street level – consumer spending. Overall consumer spending on goods and services, not adjusted for inflation, ticked up 0.1% for the month but was still up by 7.7% year-over-year. See this in the chart below and learn more here.
However, consumer spending is broken down into several categories. Consumer spending is the total money spent on final goods and services by individuals and households for personal use and enjoyment in an economy. Contemporary measures of consumer spending include all private purchases of durable goods, non-durable goods, and services.
The point is that 62% of consumer spending went to services where demand is growing and where inflation is raging – less so with durable goods and non-durable goods. Below we will examine the inflation of the three major categories of consumer spending – durable goods, non-durable goods, and services.
Spending on durable goods, not adjusted for inflation, plunged by 3.3% in November from October. Compared to a year ago, real spending on durable goods was nearly flat (+0.6%). Durable goods are new and used vehicles, appliances, electronics, furniture, etc. Spending on non-durable goods, adjusted for inflation, dipped by 0.1% in November from October and was down 1.5% from a year ago. Non-durable goods are dominated by food, fuel, and household supplies. See this in the chart below.
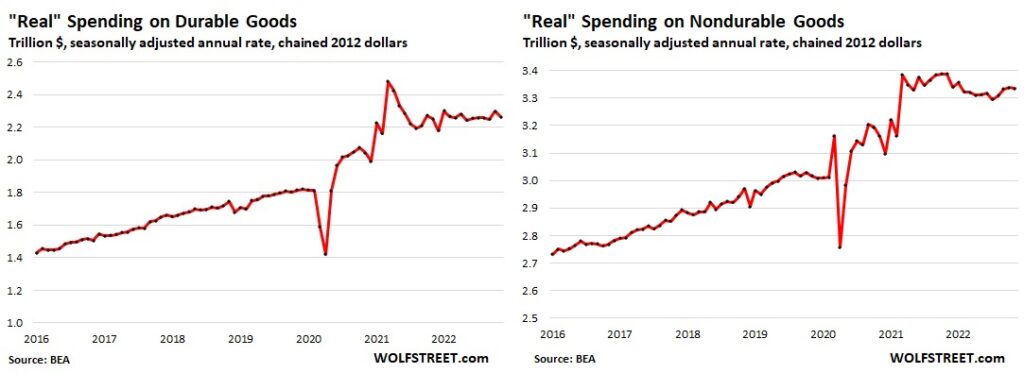
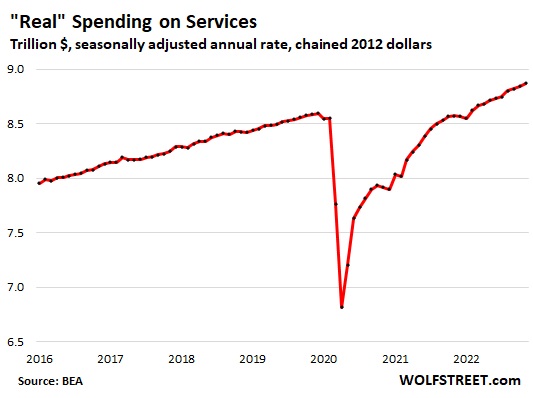
According to the Bureau of Economic Analysis, consumer spending on services jumped by 0.7% in November from October, seasonally adjusted, and 8.9% from a year ago. See this in the chart below.
So what we can see with this data is that going forward, the services component of consumer spending is driving inflation today in consumer spending. What is the outlook for services in consumer spending? What we are seeing is that the overall inflation rates are driving labor to demand higher wages which will factor into the services component of consumer spending. Hence, looking at labor activity relative to demanding higher wages is useful.
Workers across the country are joining picket lines to secure higher wages, affordable healthcare, and better working conditions at a rate that might outpace last year’s explosion of strike activity.
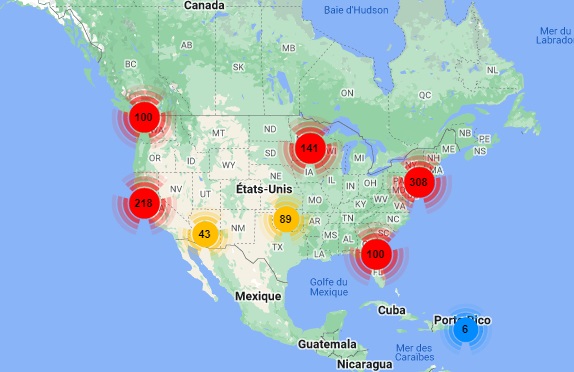
In 2021, the wave of workers who walked off the job in October inspired the term “Striketober,” and since then, strike activity has grown. Since the start of 2022, there have been more than 280 strikes – up from 158 during the same period last year, according to Cornell University’s Labor Action Tracker. See the most recent Labor Action Tracker map below and learn more here.
A cyclical inflation phenomenon is starting to appear. Higher durable goods and non-durable goods will cause demand for higher wages and their subsequent rise in services consumer spending – then rinse and repeat. Where the cycle ends will primarily be driven by the monetary base increases that feed the phenomenon. The monetary base increases will primarily be driven by excesses in government spending and the Fed’s printing of money via its policies.
As the Fed raises interest rates, it will induce a recession to stamp out demand and the 40-year high inflationary effects. However, politically the recession (potentially severe recession) required to stamp out 40-year high inflation simply will not be salable to the voting public, though some would disagree. Hence, the Fed will most likely pivot and stop the rate hikes. But subsequently, this will rekindle the inflationary effects – then rinse and repeat.
Some believe that a Fed policy mistake will cause inflation in the back half of 2023 to be significantly higher than in 2022.
The Fed has painted itself into a box trying to walk a tightrope – “dammed if they do and dammed if they don’t.” There will be no easy way out of this situation.
By Tom Williams
