

Overview
Based on data from a U.S. Treasury report, the federal government has amassed $142 trillion in debts, liabilities, and unfunded obligations. This staggering figure equals 93% of all the wealth Americans have accumulated since the nation’s founding, estimated by the Federal Reserve to be $152 trillion.
Unlike other measures of federal red ink that cover an arbitrary period, extend into the infinite future, or ignore government resources, the figure of $142 trillion applies strictly to Americans who are alive right now and includes the government’s commercial assets. Thus, it quantifies the financial burden that today’s Americans are leaving to their children and future generations.
Complete v. Incomplete Accounting
Federal law requires the U.S. Treasury to publish an annual report that details the government’s “overall financial position.” In addition to the national debt, the “Financial Report of the United States Government” also includes the government’s explicit and implicit financial commitments, such as:
- federal employee pensions and other retirement benefits like healthcare.
- environmental liabilities like contaminated nuclear sites.
- unfunded obligations for social insurance programs like Medicare.
Such “fiscal exposures,” as explained by the U.S. Government Accountability Office, “represent significant commitments that ultimately have to be addressed.” Thus, GAO stresses that ignoring them can “make it difficult for policymakers and the public to adequately understand the government’s overall performance and true financial condition.”
Yet, that is precisely what the media does. Although the Treasury published the report in February, Google News indicates that no major media outlet has mentioned it. Meanwhile, the same outlets have frequently reported on the national debt and federal budget, which are incomplete measures of the federal government’s fiscal situation.
The commonly cited national debt and federal budget are mainly based on cash accounting, which is the simplistic process of counting money as it flows in or out. Thus, liabilities like pension benefits for federal workers aren’t measured until they are actually paid, which is often decades after they are promised.
In contrast, the Treasury report mainly uses accrual accounting, which measures financial commitments as they are made. This is how the federal government requires large corporations to report their finances. In the words of the Financial Accounting Standards Board, which is tasked by the U.S. Securities and Exchange Commission to create private-sector accounting rules, accrual accounting is the “most relevant and reliable” way to measure the financial health of pension plans.
The same applies to other retirement benefits like healthcare. The accounting rule that governs such benefits explains that “a failure to accrue” implies “that no obligation exists prior to the payment of benefits.” Since an obligation does exist, failing to account for it “impairs the usefulness and integrity” of financial statements.
The Grand Total
A methodical tally of accrual accounting data in the Treasury report shows that the federal government has amassed $142 trillion in debts, liabilities, and unfunded obligations beyond the value of its commercial assets. This reflects the government’s finances at the close of its 2023 fiscal year on September 30, 2023.
The primary components of this burden, which are unpacked below, include:
- $26.3 trillion in publicly held national debt.
- $16.6 trillion in liabilities that are not accounted for in the publicly held debt.
- $104.2 trillion in unfunded social insurance obligations.
These figures tally to $147.1 trillion in debts, liabilities, and unfunded obligations. Offsetting this is $5.4 trillion in commercial assets owned by the federal government, leaving a grand total shortfall of $141.7 trillion.
Numbers in the trillions are hard to conceive, so it’s revealing to place them in context. The figure of $142 trillion amounts to 93% of the net wealth Americans have accumulated since the nation’s founding, estimated by the Federal Reserve to be $152 trillion. This includes all of their assets in savings, real estate, corporate stocks, private businesses, and consumer durable goods like automobiles and furniture.
The government’s $142 trillion shortfall also amounts to:
- $430,252 for every person living in the U.S.
- $1,098,087 for every household in the U.S.
- 5.2 times annual U.S. economic output (GDP).
- 30 times annual federal revenues.
Publicly Held Debt
The simplest major item quantified by the Treasury report is the publicly held debt, which is $26.3 trillion. This is the money the federal government owes to non-federal entities like individuals, corporations, state governments, and foreign governments.
Publicly held debt is a partial measure of the national debt that excludes $6.9 trillion the federal government owes to federal programs like Social Security and Medicare. The Treasury report also details these intergovernmental debts and consolidates them with the items below.
Liabilities
Pension and other retirement benefits are a large part of compensation packages for government employees. With these generous benefits included, civilian non-postal federal employees receive an average of 17% more total compensation than private-sector workers with comparable education and work experience. Postal workers receive even greater premiums ranging from 25% to 43%.
In 2022, federal, state, and local governments spent $2.3 trillion on employee compensation, costing each household in the nation an average of $17,299.
The Treasury report shows that the federal government currently owes $14.3 trillion in pensions and other benefits to federal employees and veterans that are not accounted for in the publicly held national debt. To pay the present value of these benefits will require an average of $109,005 from every household in the United States.
The Treasury reports other liabilities of the federal government, such as:
- $124 billion in accounts payable.
- $645 billion in environmental and disposal liabilities.
- $99 billion in insurance and guarantee program liabilities.
Altogether, the Treasury records $16.6 trillion in liabilities that are not accounted for in the publicly held debt.
Social Security & Medicare
A similar but far more expensive situation exists with social insurance programs like Social Security and Medicare. This is because — contrary to popular belief — these programs don’t save workers’ taxes for their retirements. Instead, they immediately spend the vast majority of those taxes to pay benefits to current recipients. Thus, they are called “pay-as-you-go” programs.
In stark contrast, the U.S. Bureau of Economic Analysis explains that “federal law requires private pension plans to operate as funded plans, not as pay-as-you-go plans.” The reasons for this, as explained by the American Academy of Actuaries, are to increase “benefit security” and ensure “intergenerational equity.”
Social Security and Medicare, on the other hand, have levied dramatically increased tax burdens on succeeding generations of Americans, thus creating severe generational inequality. And unless retirement ages are raised or benefits are reduced in some other way, taxes will need to be increased again to keep the programs solvent.
Federal actuaries measure the unfunded obligations of Social Security and Medicare in several different ways, but only one of them approximates accrual accounting. This is called the “closed-group” unfunded obligation, which is the money needed to cover the shortfalls for all current taxpayers and beneficiaries in these programs.
In the words of Harvard Law School professor and federal budget specialist Howell E. Jackson, the closed-group measure “reflects the financial burden or liability being passed on to future generations.” These burdens are $49.8 trillion for Social Security and $53.9 trillion for Medicare. Placing these figures in context:
- Social Security’s unfunded obligations amount to an additional $272,237 from every person who currently pays Social Security payroll taxes.
- Medicare’s unfunded obligations amount to an additional $201,932 from every U.S. resident aged 16 or older.
Those shortfalls are what remain after the federal government has paid back with interest all of the money it has borrowed from Social Security and Medicare.
Social Security and Medicare differ from true pensions because taxpayers don’t have a contractual right to receive these benefits. Nevertheless, paying these benefits is an implied commitment of the federal government, and federal law requires that these programs be included in the Treasury report.
The Treasury report estimates that the combined closed group unfunded obligations of Social Security, Medicare, and some smaller social insurance programs are $104.2 trillion. This figure doesn’t include intergovernmental debt, which is consolidated with other data in the report.
Federal Assets
The Treasury also records the federal government’s commercial assets, such as:
- $922 billion in cash and other monetary assets.
- $1.2 trillion in property, plants, and equipment.
- $1.7 trillion in receivable loans, mainly comprised of student loans.
However, the report doesn’t account for federal stewardship land and heritage assets, such as national parks and the original copy of the Declaration of Independence. While these items have tangible value, the report explains that they “are intended to be preserved as national treasures,” not sold to the highest bidder to cover debts.
In total, the government owned $5.4 trillion in commercial assets at the close of its 2023 fiscal year.
Adding up the federal government’s debts, liabilities, and unfunded obligations and then subtracting the value of its commercial assets yields a fiscal shortfall of $142 trillion.
Root Causes
The first critical step in solving a problem is to understand its root causes. However, scientific surveys show that many voters are misinformed about the root causes of government debt.
A scientific, nationally representative survey commissioned in 2020 by Just Facts found that 25% of voters believe the main driver of the rising national debt is military spending. This accords with the reporting of media outlets that frequently blame the debt on military spending.
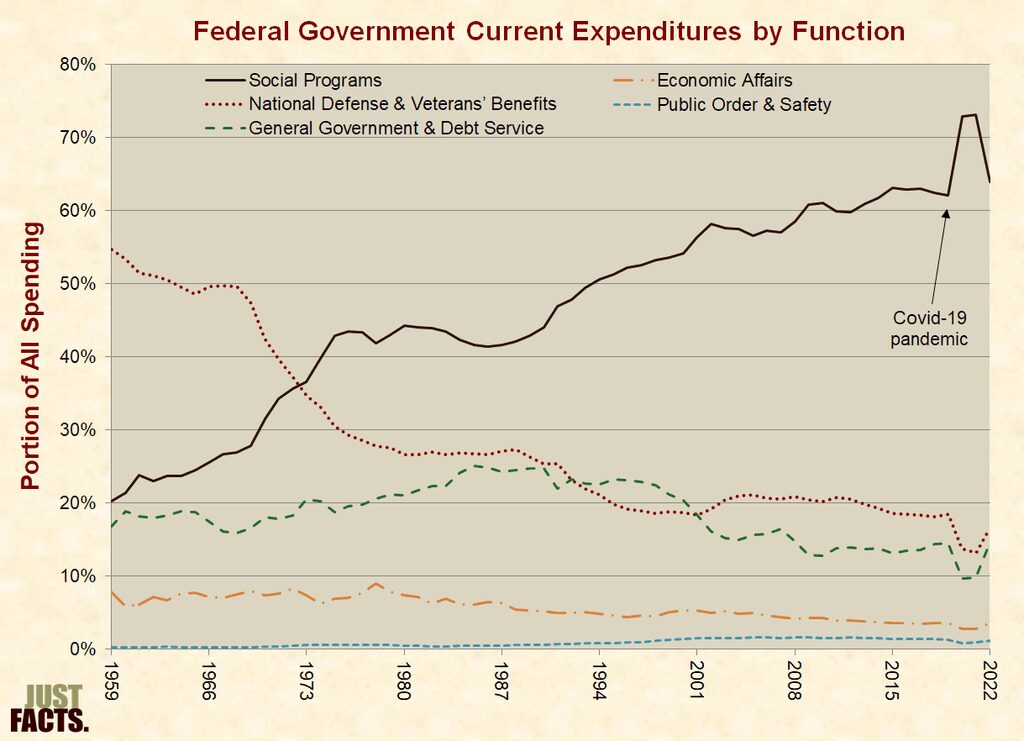
In reality, military spending has plummeted from 53% of all federal expenses in 1960 to 17% in 2022:
The same survey found that another 25% of voters believe tax cuts were the main driver of debt, in accord with news stories that blame the debt on tax cuts.
In reality, federal revenues have stayed at a roughly level portion of the U.S. economy for the past 80 years:
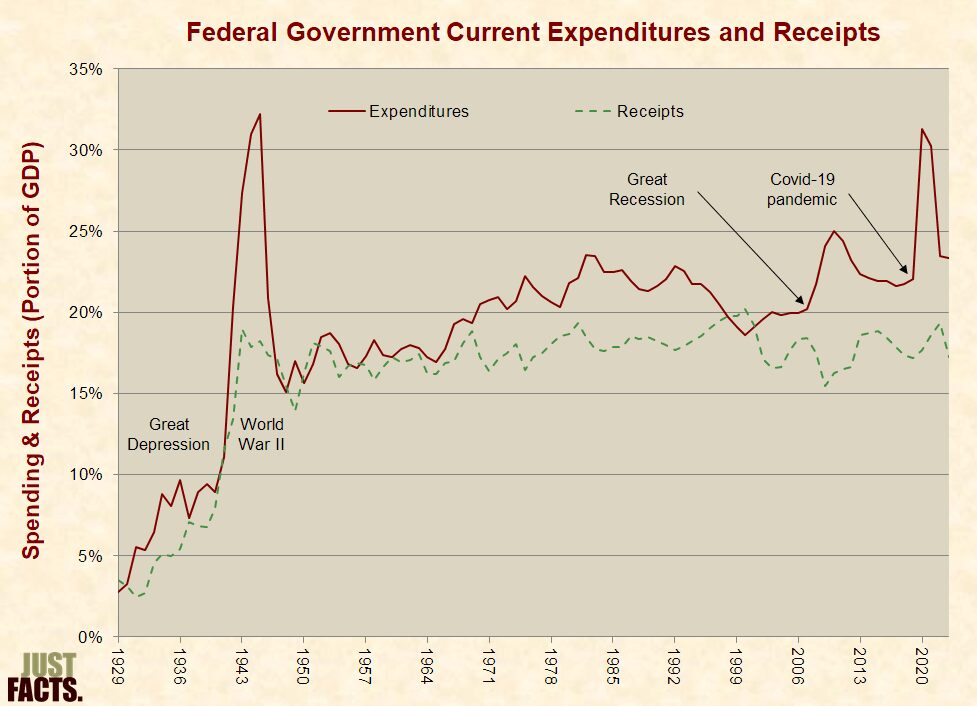
As shown in the charts above, the primary driver of the national debt is increased spending, particularly on social programs. These programs — which provide healthcare, income security, education, nutrition, housing, and cultural services — have grown from 21% of all federal spending in 1960 to 64% in 2022.
Yet, only 39% of voters correctly identify social spending as the primary cause of rising debt.
Moreover, the vast bulk of the government’s unfunded obligations are due to Social Security and Medicare. Thus, the Congressional Budget Office projects that the main drivers of future debt will be Social Security, Medicare, Medicaid, the Children’s Health Insurance Program, Obamacare, and interest on the national debt. Under the weight of these, the publicly held debt is due to soar to unprecedented levels over coming decades.
Harmful Effects
A broad range of academic publications explain that excessive government debt can cause far-reaching negative outcomes, such as lower wages, increased inflation, weak economic growth, higher taxes, reduced government benefits, or combinations of such results.
Likewise, GAO warns that “the costs of federal borrowing will be borne by tomorrow’s workers and taxpayers,” which “may reduce or slow the growth of the living standards of future generations.”
Such effects may have already begun. Although association does not prove causation, the national debt has skyrocketed over recent decades, and with this, the U.S. has experienced episodes of historically poor growth in gross domestic product, productivity, and household income. Along with this, rapid inflation has set in, another common consequence of excessive government debt.
While some believe the U.S. government can spend and borrow with abandon because it can print money, one of the most established laws of economics is that there is no such thing as a free lunch. The prolific economist William A. McEachern explains why this is so:
There is no free lunch because all goods and services involve a cost to someone. The lunch may seem free to you, but it draws scarce resources away from the production of other goods and services, and whoever provides a free lunch often expects something in return. A Russian proverb makes a similar point but with a bit more bite: “The only place you find free cheese is in a mousetrap.”
James D. Agresti is the president of Just Facts, a research and educational institute dedicated to publishing facts about public policies and teaching research skills.


