


In the 2024 presidential race, pollsters insisted the competition was too close to call in key swing states, with six out of seven states showing Harris and Trump within a 1% margin. Certainly, if these are unbiased polls the error would expect to swing in either direction. Based on these polls, a roughly equal likelihood existed for each candidate to outperform the polling predictions, especially within a typical 2-3% margin of error. But what actually happened?
The Results were not Random
On Election Day, Trump outperformed the final polls in all seven swing states by an average of 2.43% per state. While this figure falls near the margin of error, the pattern defies probability; it’s statistically unlikely for all seven states to lean in one direction if the polls were truly unbiased.
Looking Beyond the Swing States
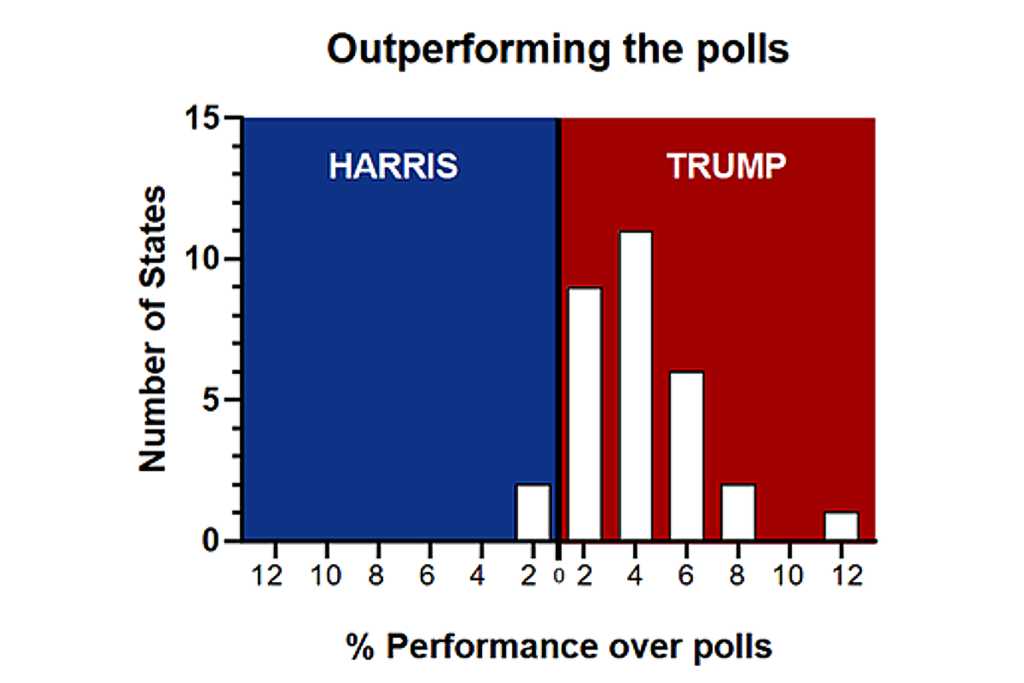
Expanding the analysis to the 31 states which had polling data published right up until election day (from FiveThirtyEight), the trend becomes even clearer: in 29 of those states, Trump exceeded poll predictions. Harris only surpassed the polls in two states. The average difference in election performance relative to the final poll results in those 31 states was 2.86% in Trump’s favor, when each state is weighted equally. When weighted by the number of electoral votes in each state, Trump outperformed the last poll results by an average of 3.77%. This broad skew raises questions about the methods and reliability of pre-election polling data.
Unpacking Bias in Polls
If poll data were unbiased, we’d expect performance differences to form a bell curve centered around zero, about as wide as the margin of error of the poll. But as seen in this Figure, the distribution of actual performance relative to polls was anything but normal. This deviation suggests potential flaws in polling methodologies or, possibly, an agenda to shape rather than reflect public opinion.
Models vs Reality: Polls vs Vote Counts
Polls, like scientific models, aim to represent complex systems—in this case, predicting voter behavior based on limited data. However, these polls are an estimate based on assumptions or expectations, not an exact measure. The final results serve as a reality check, highlighting gaps in polling accuracy. So, is the issue simply a methodological inadvertent bias due to incorrect assumptions, or do pollsters consciously skew data to influence public perception?
Parallels with Climate Models.
This discrepancy in polling accuracy resembles issues in climate change modeling. Both polling and climate predictions simplify complex systems to predict outcomes, relying on a limited set of variables while potentially overlooking critical factors. Just as climate models struggle with countless variables influencing global temperatures or CO2 levels, pollsters face the challenge of predicting voter behavior based on algorithm inputs and limited data sets. What variables need to be measured? How much weight should each variable be given? How are interactions between variables compensated for? Whether it’s polls or climate models, there are guaranteed to be variables that would be impactful to the system but remain unknown or unmeasured.
The election system is big, but not as overwhelming as the earth’s climate system. Polls also have an actual definitive result within a reasonable timeframe, meaning the actual election is going to give us certain data with which to evaluate the usefulness of the previous models (polls). Even with such a relatively small system, the polls are off the mark. How much more so with models of climate change.
“Hockey Stick” Graphs
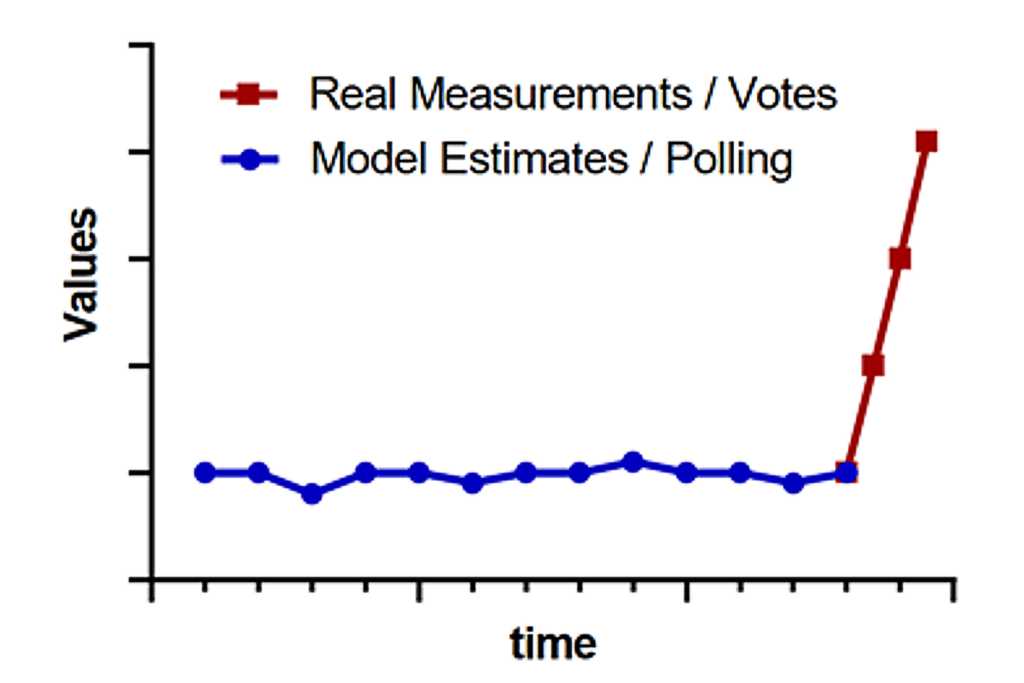
Plotting the final election results against pre-election polling data yields a “hockey stick” effect—a sharp deviation between stable polling predictions and actual voter outcomes. This parallels the well-known “hockey stick” shape seen in climate data, where models show recent spikes in temperatures after centuries of stability. The problem with this type of graph is that results from a model (polls) are on the same graph as actual measured data (vote counting). Just as the hockey stick CO2 graphs include estimates of historical CO2 levels based on indirect measurements of ice core samples filtered through model “algorithms” alongside more recent measurements CO2 taken in real time. Both cases raise the question: are we witnessing actual huge changes in previously stable trends, or simply exposing inaccuracies in predictive models?
Final Thoughts
As polling organizations analyze the model-reality gap, it’s important for consumers to approach polling data critically to regain public trust. But do we need polls? Polls risk influencing voter behavior, potentially altering the outcome they aim to predict. If a candidate initiated a campaign for supporters to decline to participate in polls, the trustworthiness of polls could be intentionally quashed. Perhaps we would be in a better place if voters did not have the distractions of the polls, preserving a more independent decision-making process based on candidates’ values and policies.
Are we relying on models—or on real insights to guide our decisions?


